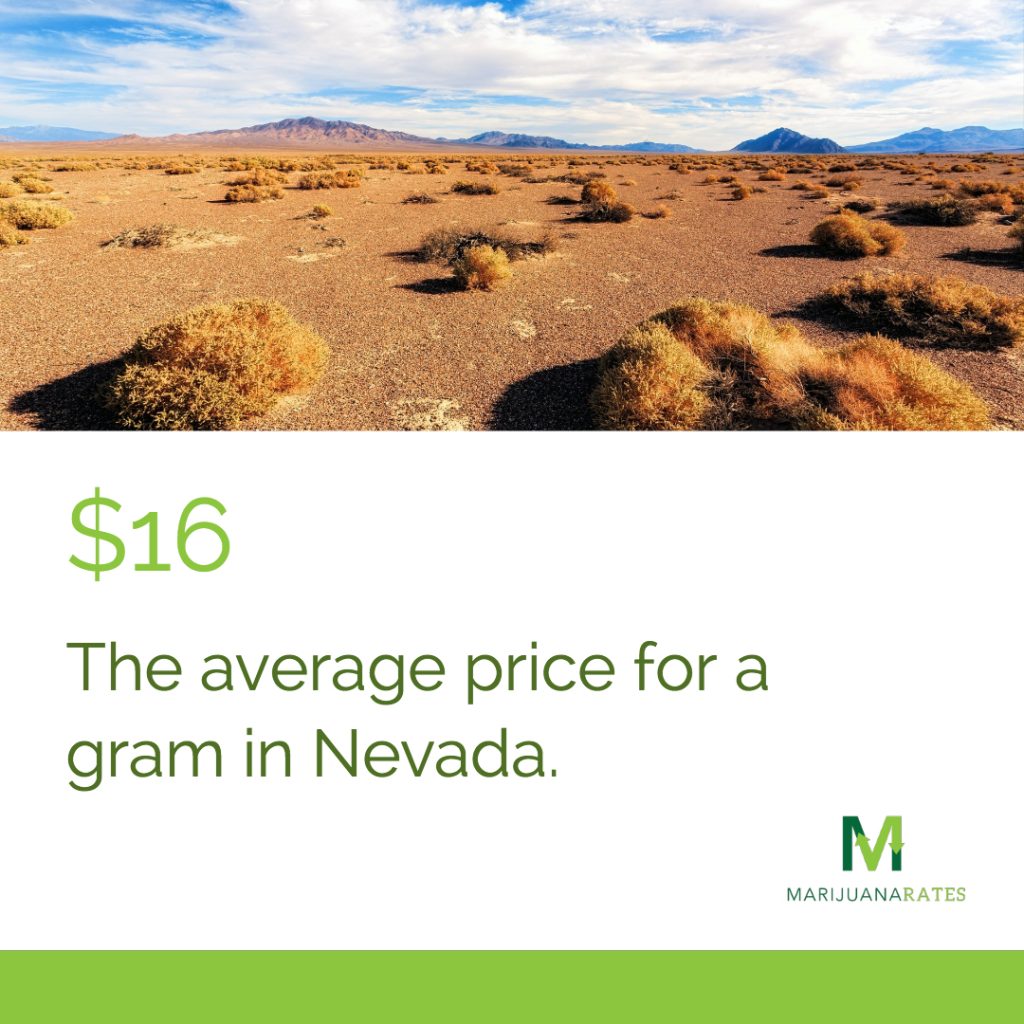
Nevada marijuana prices have remained fairly steady overall this year, with only small fluctuations. As the quantities get larger, the fluctuations get larger, but not by much.
For example, the average price for a gram in the state is currently $15.91. In January of this year, the average was $16.39. For an ounce, you’ll currently pay an average of $323.55, while in January you would have paid an average of $328.27.
But remember, these are average prices. Savvy shoppers can almost always find better deals.
And keep in mind that prices vary by city, strain, season and other variables.
Right now you’ll pay the most on average if you live in Henderson. But that doesn’t mean you won’t be able to find some great prices on top cannabis strains, concentrates and edibles.
You can use our cannabis comparison tool to find the best deals in your area.
Medical vs. recreational prices
The legalization of recreational cannabis in Nevada caused the tax on wholesale cannabis to jump up drastically. And it’s still rising.
“It’s not necessarily a dearth of supply, it’s rigorous testing standards keeping prices high,” Alex Taracki, CEO of Even Cannabis Company, a Las Vegas-based infused product manufacturer, told Marijuana Business Daily. “Nevada’s the only legal state that’s testing microbials in parts per billion, not million,” he added.
In addition, Taracki notes that cultivators in the state are having a lot of issues with humidity. And around 40% of marijuana crop is failing tests for microbials, making it tough to meet demand.
Here are average Nevada marijuana prices for summer 2018:
| Area | Gram | Ounce |
|---|---|---|
| State Average | $16 | $324 |
| Las Vegas | $15 | $321 |
| Reno | $15 | $320 |
| Henderson | $18 | $330 |
 Las Vegas average marijuana prices
You can pick up a gram of cannabis in Las Vegas for just $15. But there are at least a handful of dispensaries offering rates below that average. You’ll save even more on larger quantities. In fact, if you’re buying an ounce per month, you can save nearly $350 or more per year just by comparison shopping.
| Dispensary | Gram Average |
|---|---|
| Canopi Downtown | $13 |
| Blackjack Collective | $14 |
| Blum | $14 |
Reno average marijuana prices
If you’re in the Reno area, expect to pay an average of around $15 per gram. It’ll cost you an average of $320 for an ounce. But shopping for deals can help keep your costs down. In fact, if you pick up an ounce per month, you can save somewhere around $700 or more per year.
| Dispensary | Gram Average |
|---|---|
| Sierra Wellness | $13 |
| Blum | $14 |
| Silver State Relief | $14 |
Henderson average marijuana prices
Henderson is one of the more expensive cities in Nevada to buy cannabis. The average per gram is $18. And the average per ounce is $330, or around $10 more than in Las Vegas or Reno. Comparison shopping can save you somewhere around $300 or more per year, assuming you buy an ounce per month.
| Dispensary | Gram Average |
|---|---|
| Jenny’s Dispensary | $14 |
| Top Notch THC | $17 |
What to look for in a dispensary
Mikel Alvarez, Director of Retail Operations for TerraTech, points out that this is very subjective. “Each patron is looking for something different for the most part,” he says.
But make sure you’re speaking with a trained budtender who will be able to listen to your needs and help choose the right products.
“This is very important, because each product is a little different and we want to make sure that you understand what you will be consuming,” Alvarez notes.
Finding the best deals
If you want to find the best deals, the best strains and the best quality, comparison shopping is crucial.
Comparison shopping at dispensaries, in some cases, can save you more than $1,000 per year, depending on what and how much you’re purchasing.
Use our cannabis comparison tool to find the best deals in your area.
Want the latest cannabis prices in your area, the hottest deals and the best brands straight to your inbox?
Methodology: MarijuanaRates surveys dispensaries in areas throughout the nation monthly. Using that data, we calculate a price average for each city and state. National averages are based on overall state averages throughout the nation. City averages are based on overall city averages through a particular state. These averages do not include taxes, which vary from state-to-state and city-to-city.
Last updated July 2018

